U.S. Workers Regain Faith in Finding Good Job if Laid Off
Friday, May 13th, 2016
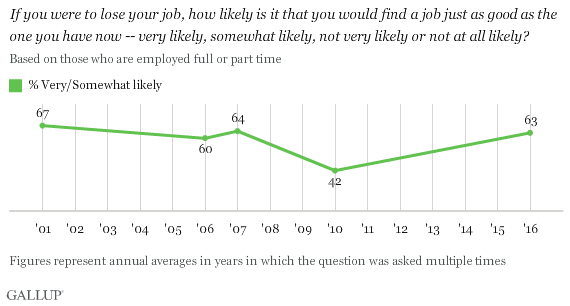
After plummeting in 2010, Americans' confidence that they would find a job as good as their current one if they happened to be laid off has been restored. Currently, 63% believe it is very or somewhat likely that they would find a job as good as the one they have, up from 42% six years ago. The current figure is similar to what Gallup measured in early 2007, before the recession.

When Gallup last asked this question, in April 2010, the Bureau of Labor Statistics unemployment rate was 9.9%. This April, it is 5.0%.
Those positive employment trends are likely one factor in Americans' greater confidence in finding comparable work if they were to lose their job. Whether their confidence is warranted is unclear, though, partly because the job growth in recent years has come disproportionately among lower-paying and part-time jobs.
The unemployment rates were similar to the current level -- slightly below 5% -- when Gallup asked the question in 2001, 2006 and 2007. In the 16-year history of the trend, the 2010 measurement is the only one in which the employment situation was dramatically different from the other years.
Upper-Income Workers' Assessments of Prospects Have Brightened Considerably
Six years ago, workers residing in upper-income households and those residing in middle- and lower-income households evaluated their job opportunities similarly, with 41% of each group saying it was likely that they would find a job similar to their current one. Now, upper-income workers (70%) are significantly more likely than middle- and lower-income workers (58%) to believe they could find a job just as good as their current one if they were laid off. This could indicate that the jobs recovery has not been equal among income groups, particularly for middle-income workers.
Workers of differing education levels, ages and genders show similar gains since 2010.
Changes in Perceived Likelihood of Being Able to Find a Job Just as Good as the Current One if Laid Off, by Subgroup
Based on adults employed full or part time
|
|
2010% |
2016% |
Changepct. pts. | ||||||||||||||||||||||||||||||||||||||||||||||||||||||||||||||||||||||||||||||||||||||||||||||||
|---|---|---|---|---|---|---|---|---|---|---|---|---|---|---|---|---|---|---|---|---|---|---|---|---|---|---|---|---|---|---|---|---|---|---|---|---|---|---|---|---|---|---|---|---|---|---|---|---|---|---|---|---|---|---|---|---|---|---|---|---|---|---|---|---|---|---|---|---|---|---|---|---|---|---|---|---|---|---|---|---|---|---|---|---|---|---|---|---|---|---|---|---|---|---|---|---|---|---|---|
|
Age | |||||||||||||||||||||||||||||||||||||||||||||||||||||||||||||||||||||||||||||||||||||||||||||||||||
|
18 to 34 years |
52 |
73 |
+21 |
||||||||||||||||||||||||||||||||||||||||||||||||||||||||||||||||||||||||||||||||||||||||||||||||
|
35 to 54 years |
40 |
60 |
+20 |
||||||||||||||||||||||||||||||||||||||||||||||||||||||||||||||||||||||||||||||||||||||||||||||||
|
55+ years |
30 |
51 |
+21 |
||||||||||||||||||||||||||||||||||||||||||||||||||||||||||||||||||||||||||||||||||||||||||||||||
|
Education | |||||||||||||||||||||||||||||||||||||||||||||||||||||||||||||||||||||||||||||||||||||||||||||||||||
|
College graduate |
48 |
69 |
+21 |
||||||||||||||||||||||||||||||||||||||||||||||||||||||||||||||||||||||||||||||||||||||||||||||||
|
College nongraduate |
38 |
59 |
+21 |
||||||||||||||||||||||||||||||||||||||||||||||||||||||||||||||||||||||||||||||||||||||||||||||||
|
Annual Household Income | |||||||||||||||||||||||||||||||||||||||||||||||||||||||||||||||||||||||||||||||||||||||||||||||||||
|
Less than $75,000 |
41 |
58 |
+17 |
||||||||||||||||||||||||||||||||||||||||||||||||||||||||||||||||||||||||||||||||||||||||||||||||
|
$75,000 or more |
41 |
70 |
+29 |
||||||||||||||||||||||||||||||||||||||||||||||||||||||||||||||||||||||||||||||||||||||||||||||||
|
Gender | |||||||||||||||||||||||||||||||||||||||||||||||||||||||||||||||||||||||||||||||||||||||||||||||||||
|
Male |
42 |
63 |
+21 |
||||||||||||||||||||||||||||||||||||||||||||||||||||||||||||||||||||||||||||||||||||||||||||||||
|
Female |
41 |
62 |
+21 |
||||||||||||||||||||||||||||||||||||||||||||||||||||||||||||||||||||||||||||||||||||||||||||||||
|
Gallup |
|||||||||||||||||||||||||||||||||||||||||||||||||||||||||||||||||||||||||||||||||||||||||||||||||||
Younger workers are much more likely than older workers to believe they would find a job just as good as the one they have if they were forced to find one. Currently, 73% of 18- to 34-year-old workers are optimistic about finding such a job, compared with 51% of workers aged 55 and older. Those age differences are typical of what Gallup has found previously and may reflect that younger workers have a wider range of opportunities, given that they are less likely to be established in a particular career or industry than older workers. Partly because of that, employers may prefer younger workers because they would tend to make less money than older workers.
College graduates (69%) are more optimistic than those without a college degree (59%) about finding a suitable new job if needed, as is typically the case.
Working men and working women are equally likely to believe they could find a job just as good as their current one.
Workers See Little Chance of Losing Their Job
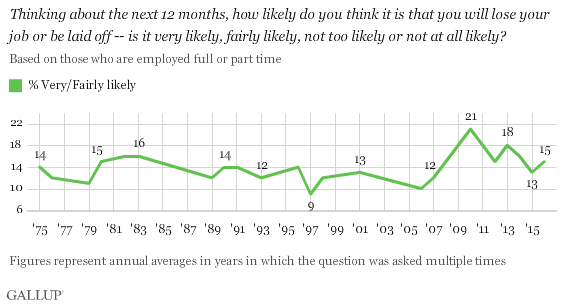
Since 1975, Gallup has routinely asked U.S. workers to assess the likelihood that they will lose their job. The vast majority of workers have always viewed being laid off as a remote possibility. Today, just 15% say it is very or somewhat likely that they will be laid off in the next 12 months. That remains down from the high point of 21% in 2010, and essentially matches the historical average of 14%.

Typically, workers' concerns about being laid off are similar by gender and age, but differ by socioeconomic status. Since 2001, an average of 17% of workers without a college degree have said it was likely that they would be laid off in the next 12 months, compared with 10% of workers with a degree. And 18% of workers in lower- and middle-income households worry about being laid off, compared with 9% of upper-income workers.
Implications
The Great Recession and its aftermath produced a period of heightened financial anxiety for many Americans. Amid unemployment rates near double digits, a record-high percentage of U.S. workers worried about being laid off, and workers' confidence in being able to find another decent job if that happened tumbled by 22 percentage points.
By June 2014, the Bureau of Labor Statistics estimated that the U.S. had recovered all the jobs lost in the recession. Americans are just as optimistic now as before the recession that they would find similar employment if they lost their job. At the same time, the jobs recovery has been uneven -- stronger in some industries than others, and showing much more limited growth in middle-income jobs than in lower-paying jobs.
Americans' increasing optimism about their job prospects has been reflected in the growing number of employees quitting their job voluntarily, in most cases presumably because they have found another job. Whether that trend continues -- especially in light of the BLS report showing that April job growth did not meet expectations -- may depend on whether the U.S. economy can grow at a stronger pace than it did in the first quarter of 2016.


